
Looking for a way to grow your Instagram account? Well, checking Instagram analytics is the place to start!
Are you seeing the results you want from your Instagram marketing efforts? Ever wondered if there’s a way to figure out how successful Instagram marketing strategies are? In the world of social media, data is really important.
Instagram analytics helps you discover what works, generate new ideas, target your audience, and improve your posts to reach your goals. This guide explores key metrics and offers free tools for tracking Instagram analytics.
In this guide, we’re going to explore Instagram analytics together. We’ll look at important metrics and even give you some free Instagram analytics tools to help you keep track.
So, are you excited to learn how to make your Instagram better by understanding the information it gives you? Let’s get started!
What Are Instagram Analytics?
Instagram Analytics are tools that show you important information about how well your posts and account are doing on Instagram. They show numbers and facts about your posts, like how many people saw or liked them. They even reveal details like when your followers are online the most.
Looking at these numbers is the only real way to plan well on Instagram. Without data, you’re just guessing. Numbers make your plans more certain and prove your work’s value to your boss.
In addition, Instagram analytics help you understand your followers. You learn when they use Instagram most and what posts they prefer. This helps plan your posts. Without numbers, you’re guessing blindly.
You may confused:
What’s the Difference Between Instagram Analytics And Insights?
Instagram Insights are individual pieces of data, such as impressions, engagement, post interactions, and profile activity. On the other hand, Instagram analytics involves a deeper analysis of your data over time. It’s about tracking trends, measuring growth, and understanding patterns rather than just counting individual numbers.
You may consider:
Why Are Instagram Analytics So Important?
Instagram analytics helps you make smarter decisions about Instagram influencer marketing strategies and create posts to grow your account effectively. With the help of Instagram analytics, you can:
1. Leading the Way
Instagram analytics provide valuable data, such as identifying your top-performing posts and optimal posting times. This information helps you become a leader in your field by using smart strategies. For example, knowing when most of your followers are active lets you schedule your posts at the most opportune times, ensuring maximum engagement and impact.
2. Knowing Your Fans
These analytics also tell you about your audience, like their age, gender, and where they’re from. This helps you make personalized content, just like how you’d pick a great gift for a friend who likes specific things.
3. Saving Time and Money
Analytics show what works and what needs improvement. Instead of guessing and wasting time and money everywhere, you can focus where it counts. This makes your marketing efforts more efficient.
4. Planning for Success
To run a good campaign, you need to understand trends and growth. Instagram analytics help you see how your campaign is doing over time. You can spot the best moments and adjust your plan based on real numbers, not guesses.
You may ask, what should you look for on analytics reports? Let’s see!
Key Instagram Analytics Metrics You Need to Know?
These Instagram analytics metrics provide valuable information that can guide your content strategy, help you reach a wider audience, and improve your overall performance on the platform. Here are key metrics to track by using Instagram analytics tools:
#1 Instagram Account Analytics
This kind of data-driven information provides valuable insights into the performance of your Instagram profile. Here are some key Instagram follower analytics to help you understand how your content is resonating with your audience and driving engagement:
Engagement Rate
This metric shows the percentage of your followers or reach that have engaged with your posts. It helps you gauge how well your content is connecting with your audience and motivating them to take action.
Follower Growth Rate
It will show your followers’ (negative) growth over time. It’s a crucial metric as it directly impacts the visibility of your content to a wider audience.
Website Referral Traffic
If you’re a business and have a website, this metric tracks the number of visitors that Instagram directs to your website. It’s particularly important if you’re aiming to boost your Instagram return on investment (ROI) and link your Instagram efforts to your goals beyond the platform.
Most Effective Times to Post
By analyzing this metric, you can identify the times when your posts receive the highest engagement. Posting at the best times to post on Instagram can maximize the response from your audience.
Audience Demographics
Even though it’s not just one number, this bunch of information gives you a look into things like the ages, genders, where people are, and what they’re interested in. Knowing these details helps you make content that really connects with the people you want to reach.
#2 Instagram Posts Analytics and Insights
Here are key metrics to watch on Instagram analytics reports:
Instagram Posts Engagement Rate
This shows how many people like, comment, or share your post compared to your followers. It helps you know if people are interested in your stuff. Some tools can do this math for you.
Instagram Posts Comment Rate
This tells you how many comments your post gets compared to your followers. If you want to make friends and build a community, tracking comments separately helps see how much people are engaging.
Posts Impressions
This number says how many times your post is seen. It shows if you’re getting the word out well.
Instagram Posts Reach
Reach is about how many different people see your post. If lots of people see it, it means your content is engaging and the Instagram system is sharing it.
Looking at these numbers lets you understand how well your Instagram posts are doing. You can find what people like and what they don’t. The good news is that the Instagram algorithm also lets you filter your search to look at specific numbers you care about. Amazing, isn’t it?
Now, you may say the stories work great, but the reality might be different for you. You need to track Instagram story analytics and see for yourself.
#3 Instagram Stories Analytics
Despite the temporary nature of the Stories themselves, the associated data remains accessible for analysis. This information proves invaluable for optimizing your Stories strategy through informed decision-making.
For example, even though some trends might say Reels or Carousels are better, your own industry, audience, and content can give different results. This shows how trying things out and looking at your own results is important. When you know your analytics well, you can confidently try new things to make your approach better and get the best outcomes.
The analytics offer insights into various aspects of your Stories’ performance, including:
Frequency and Timing
By analyzing your Stories analytics, you can determine how often you should publish new Stories each week. Additionally, you can assess whether the timing of your posts influences the number of impressions and engagements they receive.
Story Engagement Rate
This metric calculates the number of engagements (likes, comments, shares, etc.) your Stories receive as a percentage of your followers or reach. A higher engagement rate indicates that your content is resonating well with your audience.
Completion Rate
The completion rate reflects the percentage of viewers who watch your entire Story. A high completion rate indicates that your content is captivating and holds the attention of your audience throughout the entire duration.
Now, it’s time to take a look at the next Instagram analytics metric: Reels analytics!
#4 Instagram Reels Analytics
These metrics offer a comprehensive view of how your Reels are resonating with your audience:
Reel Shares
This metric indicates the number of users who have shared your Reel with others. It reflects the extent to which your content is resonating and encourages viewers to share it within their networks.
Reel Interactions
Reel interactions encompass a combination of key engagement actions, including likes, comments, shares, and saves. These actions show how well your Reel is getting people interested and talking about it.
Drop-Off Rate
The drop-off rate indicates the percentage of viewers who stop watching your Reel before it reaches its conclusion. Monitoring this metric helps identify points in your content where viewers lose interest, enabling you to refine your storytelling and maintain engagement.
Accounts Reached
This metric calculates the unique accounts that have had your Reel appear on their screens, regardless of whether the Reel was played. It’s distinct from impressions, which could include multiple views by the same accounts.
Plays
Plays represent the number of times your Reel’s video has started playing, whether through automatic play or user-initiated play. Some scenarios, like viewing on mobile web browsers, might not trigger automatic play.
Watch Time
Watch time measures the cumulative duration for which your Reel was played, including any instances of replaying the video.
Average Watch Time
This metric calculates the average amount of time users spend playing your Reel. It’s determined by dividing the total watch time by the number of plays.
Now, let’s dive into
#5 Instagram Live Analytics
In addition to the standard video content metrics, Instagram offers specific insights including:
Peak Concurrent Views
This metric indicates the maximum number of viewers who were watching your livestream simultaneously at any given point. It provides insight into the level of interest and engagement your live content generated during its peak moments.
Number of Live Interactions
This metric encompasses the total count of interactions during your live broadcast, including comments and shares. Comments showcase the engagement and real-time interaction between you and your audience, while shares extend the reach of your content beyond the current viewers.
Number of Accounts Reached
This metric reveals the total number of unique accounts that were exposed to your live stream. It signifies the overall reach and potential impact of your content, giving you an idea of how many people had the opportunity to see your broadcast.
Now, we come across a big question:
How to See Instagram Analytics on Mobile?
To access Instagram analytics through Instagram Insights on your mobile device, follow these steps to learn how to check analytics on Instagram Insights:
- Launch the Instagram App: Open the Instagram app on your mobile device.
- Navigate to Your Profile: Tap on your profile picture or icon at the bottom right corner of the screen to access your profile.
- Access Professional Dashboard: Once on your profile, locate and tap on the ‘Professional Dashboard’ option. This is where you’ll find insights about your account’s performance.
- Explore Account Insights: Within the Professional Dashboard, find and select ‘Account Insights.’ This will take you to a detailed overview of your account’s analytics.
- Expand Insights: Within the Account Insights section, you will see an option that says ‘See All.’ Tap on this option to access more detailed insights about your account’s performance.
- Explore Content Overview: In the ‘See All’ section, you’ll be presented with various insights, including accounts reached, engagements, total followers, and content shared. These metrics provide you with a comprehensive understanding of how your account is performing.
- Choose a Timeframe: At the top menu of the insights page, you can select a timeframe for which you want to view the analytics. This allows you to assess your performance over specific periods.
- Dive Deeper: To gain more detailed insights about any particular metric, tap the right arrow located next to the relevant category. This action will lead you to a more in-depth breakdown of that specific metric.
Keep in mind that these steps are based on using Instagram Insights within the Instagram mobile app and are designed for business or creator accounts. By following these steps, you’ll be able to effectively utilize Instagram Insights to understand your account’s overall trends, content performance, audience engagement, and more.
How to See Instagram Analytics on Desktop?
To gain a more comprehensive understanding of your Instagram metrics and monitor your growth and engagement over time, it’s advisable to access Instagram analytics on a desktop. While quick on-the-go tracking is convenient on mobile, desktop analytics are better suited for in-depth analysis, cross-platform comparisons, and generating detailed social media reports.
Here’s a guide on how to see analytics on Instagram (on a desktop):
#1 How to See Analytics on Instagram?
The primary Instagram Insights tool isn’t directly available on a desktop. However, you can access basic analytics for individual posts from your Instagram feed. Here’s the guideline:
Navigate to your Instagram feed on the web and locate the post for which you want to view analytics. Click on ‘View insights’ under the chosen post. A pop-up window will appear, displaying metrics such as total likes, comments, saves, direct message shares, profile visits, and reach.
#2 How to See Instagram Analytics on Meta Business Suite?
For more comprehensive analytics on a desktop, transition to Meta’s Business Suite. Here’s the instruction:
- Open the Meta Business Suite platform and click on the ‘Insights’ option.
- The overview screen will present top-level insights, with Facebook metrics on the left and Instagram metrics on the right.
- Explore specific insights by selecting categories from the left menu. Clicking on ‘Content’ under the Content heading will provide insights related to Instagram content.
- To focus exclusively on Instagram content metrics without any Facebook data, click on ‘Content’ in the left menu, then access the drop-down menu under ‘Ads, Posts, and Stories.’ Here, uncheck the Facebook options.
#3 How to See Instagram Analytics by Instagram Analytics Tools?
In the subsequent section, we will introduce some of the best free tools that offer detailed data about your Instagram analytics. To use an Instagram analytics app you should follow these steps:
- Choose an Analytics Tool: There are various third-party tools available that offer comprehensive Instagram analytics. Some popular options include Iconosquare, Sprout Social, Later, and Hootsuite. Choose one that suits your needs and sign up for an account.
- Connect Your Instagram Account: Once you’ve signed up for the analytics tool, you’ll need to connect your Instagram account to it. This typically involves granting the tool permission to access your Instagram data. This step may vary slightly depending on the tool you’re using.
- Access the Analytics Section: After connecting your Instagram account, navigate to the analytics section within the tool’s dashboard. This is where you’ll find all the relevant data and insights about your Instagram account’s performance.
- Explore Different Metrics: Most Instagram analytics tools provide a variety of metrics and data points to help you understand your account’s performance.
By following these steps, you can effectively access and analyze your Instagram metrics on a desktop, gaining valuable insights to enhance your Instagram influencer marketing strategy and track your performance over time.
Top Instagram Analytics Tools
Because Instagram is huge and has many different ways to measure things, it’s a good idea to use the best Instagram analytics app. So, we’re going to tell you about the top tools for Instagram analytics.
1. Iconosquare
According to its official website, it provides insights about how your content affects engagement, helping you adjust it to boost your brand presence. Iconosquare integrates with various social networks like Instagram, Facebook, Twitter, LinkedIn, and TikTok. Using this Instagram analytics app, you can export data as visual graphs for presentations, and it offers over 100 different metrics for analysis.
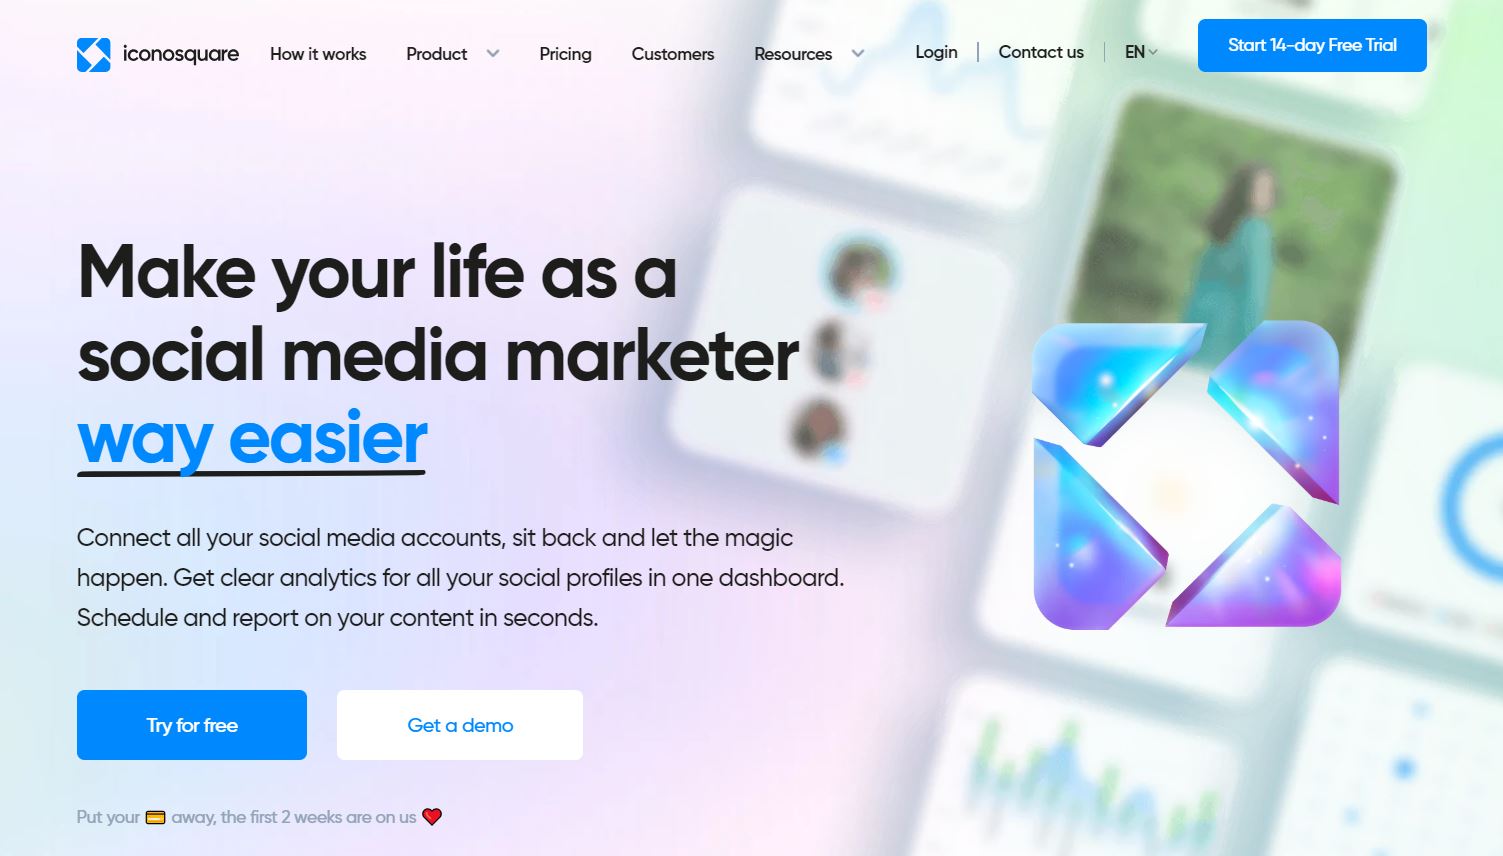
The tool lets you visualize your community’s growth, including location, languages spoken, age, and gender. With Iconsquare, you can create a custom dashboard that displays the metrics you’re interested in from engagement metrics, impression, reach, average reach per Post, and average reach rate by post, to Instagram stories performance. All this data from five social networking platforms can be managed in one place.
While Iconsquare offers a two-week free trial and some free tools like a complete Instagram Audit, it’s essential to evaluate its fit for your needs and priorities.
Iconsquare Pros
- Evolving Functionality: Iconsquare continuously updates its functionality, adapting to the changing social media landscape.
- Industry Benchmarks: Iconsquare offers valuable industry benchmarks, allowing users to gauge their performance against competitors and industry standards.
- Competitive Analysis Features: The platform provides competitive analysis features, helping businesses gain insights into their competitors’ social media strategies.
- Excellent Automated Posts: Iconsquare excels in automated post scheduling, saving time and effort for social media managers.
Iconsquare Cons
- Customer Support May Not Be Helpful: Some users have reported issues with Iconsquare’s customer support, suggesting that assistance may not always be readily available or effective.
- Some Features May Glitch: Like many software platforms, Iconsquare is not immune to technical glitches.
- Lack of PDF Reporting (Pro Plan): The absence of PDF reporting in the Pro plan can be frustrating for users who prefer this format for sharing and presenting their data.
Iconsquare Pricing
Iconsquare offers flexible pricing options based on your needs. You can also save up to 22% by choosing to pay annually. Each plan comes with a 14-day free trial.
Pro Plan:
- Monthly: 59€
- Annually: 49€/month
Advanced Plan:
- Monthly: 79€
- Annually: 99€/month
Enterprise Plan:
- Monthly: 139€
- Annually: 179€/month
2. Hootsuite
If you want to show your Instagram results in your social stream, it claims to offer a professional plan that includes social media analytics. This gives you a quick view of your important data every day. When you want more details, you can check out the Instagram overview report or dive into specific metrics and customizable reports.
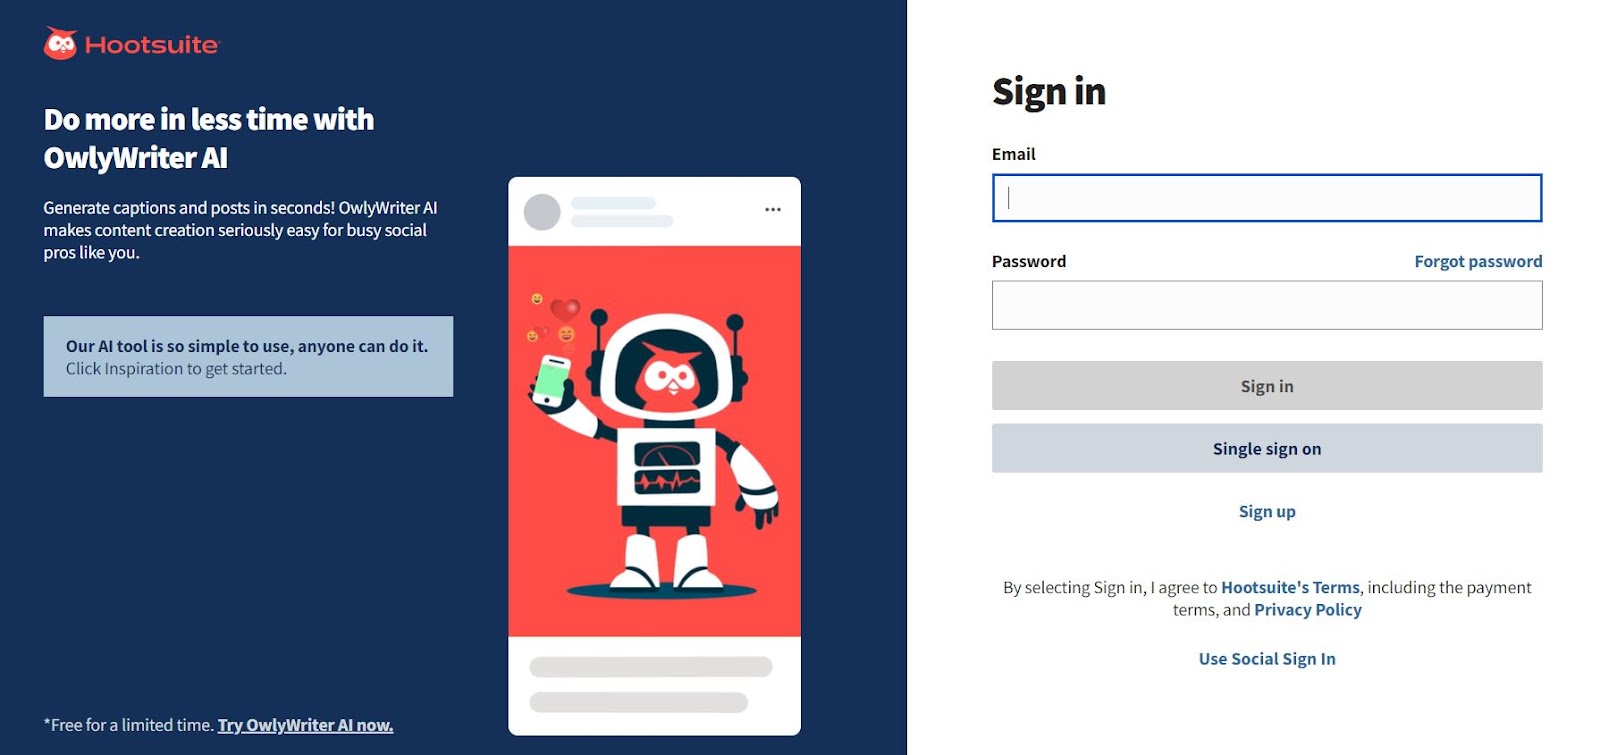
According to their claims, you can share these reports with others in your organization easily. Hootsuite promises to help you track Instagram data more deeply than Instagram Insights. For instance, you can analyze data from a long time ago, compare different time periods, and find the best times to post. You can also create custom reports and schedule them to be sent to your inbox regularly.
Hootsuite Pros
- Effective Data Aggregation: Hootsuite excels at consolidating data from various platforms, providing valuable insights into interaction levels across social media channels.
- User-Friendly Mobile Site: The mobile site offers a user-friendly experience, making it convenient to manage social media on the go.
- Appealing Layout: Hootsuite’s layout, featuring a monthly calendar view, is visually appealing and aids in organizing social media activities.
Hootsuite Cons
- Overwhelming Interface: Some users find Hootsuite’s interface overwhelming, especially when compared to competitors, which may lead to a steeper learning curve.
- High Monthly Costs: Hootsuite can be costly on a monthly basis, potentially straining budgets for some businesses.
- Confusing Toolset: The toolset provided by Hootsuite may be considered bloated by some users, leading to confusion about which features to use for specific tasks.
Hootsuite Pricing
Here are the Hootsuite pricing plans and their respective costs:
- Professional: €99 per month.
- Team: €249 per month.
- Business: €762 per month.
- Enterprise: Custom pricing (Starts at 5 users and 50 social accounts).
3. Later
It claims to offer an Instagram Analytics feature that helps you understand how your posts are doing. Later has a user-friendly dashboard where you can see the performance of your posts, stories, and Reels for up to a year. You can check important numbers like likes, reach, and comments. It also provides insights about your audience, like their location and when they’re most active.
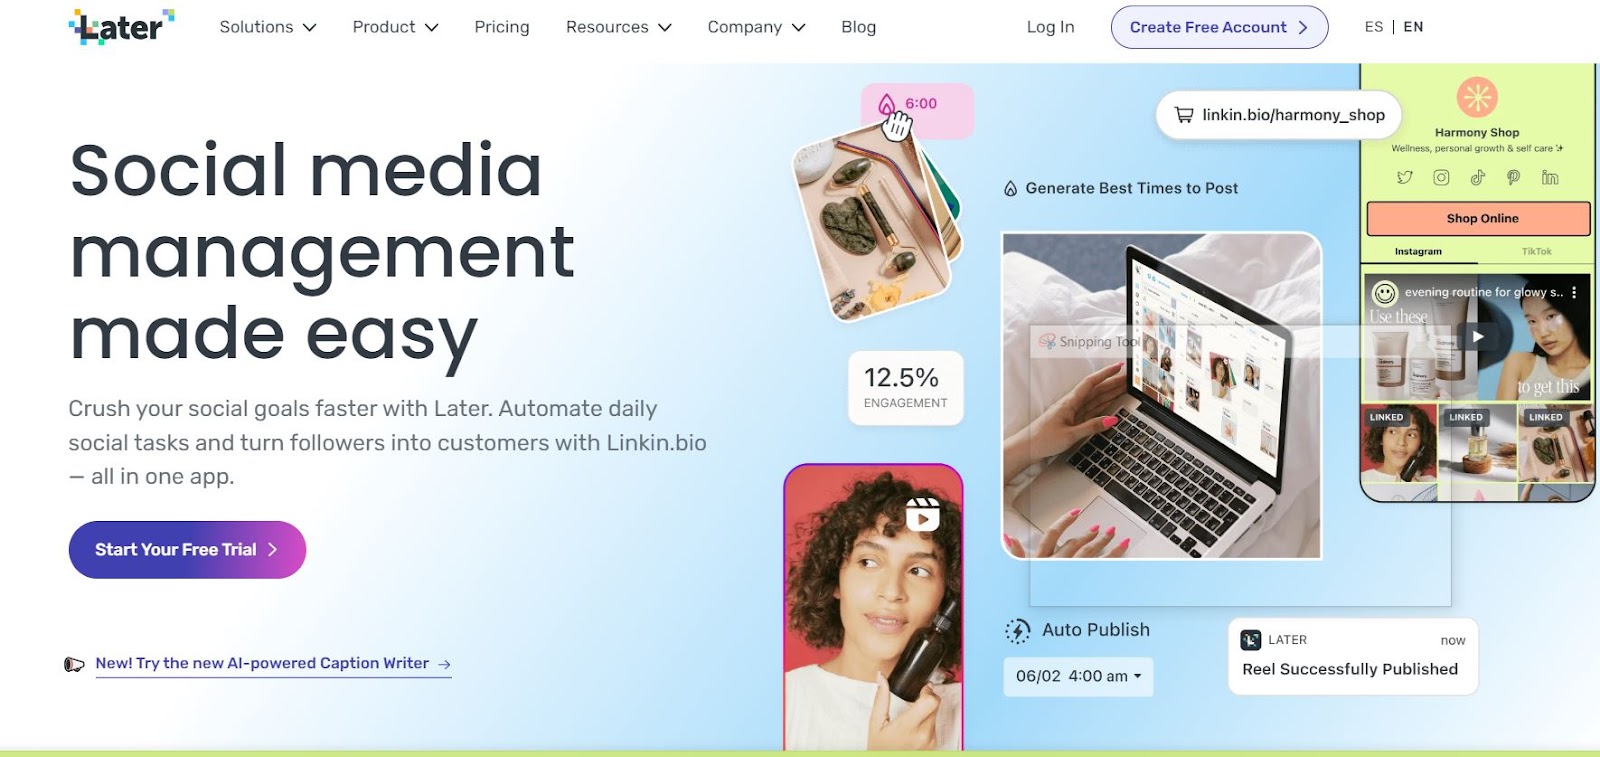
It asserts to help you find your Instagram hashtag analytics. You can see which hashtags are getting the most likes, comments, saves, and reach for your Instagram posts.
Later Pros
- User-Friendly Interface: Later offers an easy-to-use platform with a straightforward interface, making it accessible for users of all experience levels.
- Competitive Pricing: Later provides competitive pricing plans, making it an affordable option for individuals and businesses looking to manage their social media scheduling and content.
- ‘Best Time to Publish’ Feature: The ‘Best time to publish’ feature helps users optimize their posting schedule for maximum engagement and reach on social media platforms.
Later Cons
- Requirement for Business Accounts: To access some of Later’s features, users are required to have business accounts on social media platforms. This could be a limitation for those using personal profiles.
- Limited Features Compared to Competitors: Later may have limitations in terms of advanced features compared to some of its competitors (such as social listening, and in-depth reporting).
- Basic Features in Free Version: While Later offers a free version, it comes with basic features. Users seeking more advanced capabilities may need to upgrade to a paid plan, which could be a downside for those on a tight budget.
Later Pricing
Here are Later’s pricing plans:
- Starter: $25 USD/month.
- Growth: $45 USD/month.
- Enterprise: Contact for pricing.
4. Analisa.io
Analisa.io provides a comprehensive suite of analytics for Instagram and TikTok. It covers profile and competitor analysis, follower demographics, campaign reporting, historical data, and content optimization. It’s a free Instagram analytics tool that offers insights into social media performance but should be evaluated for your specific needs.
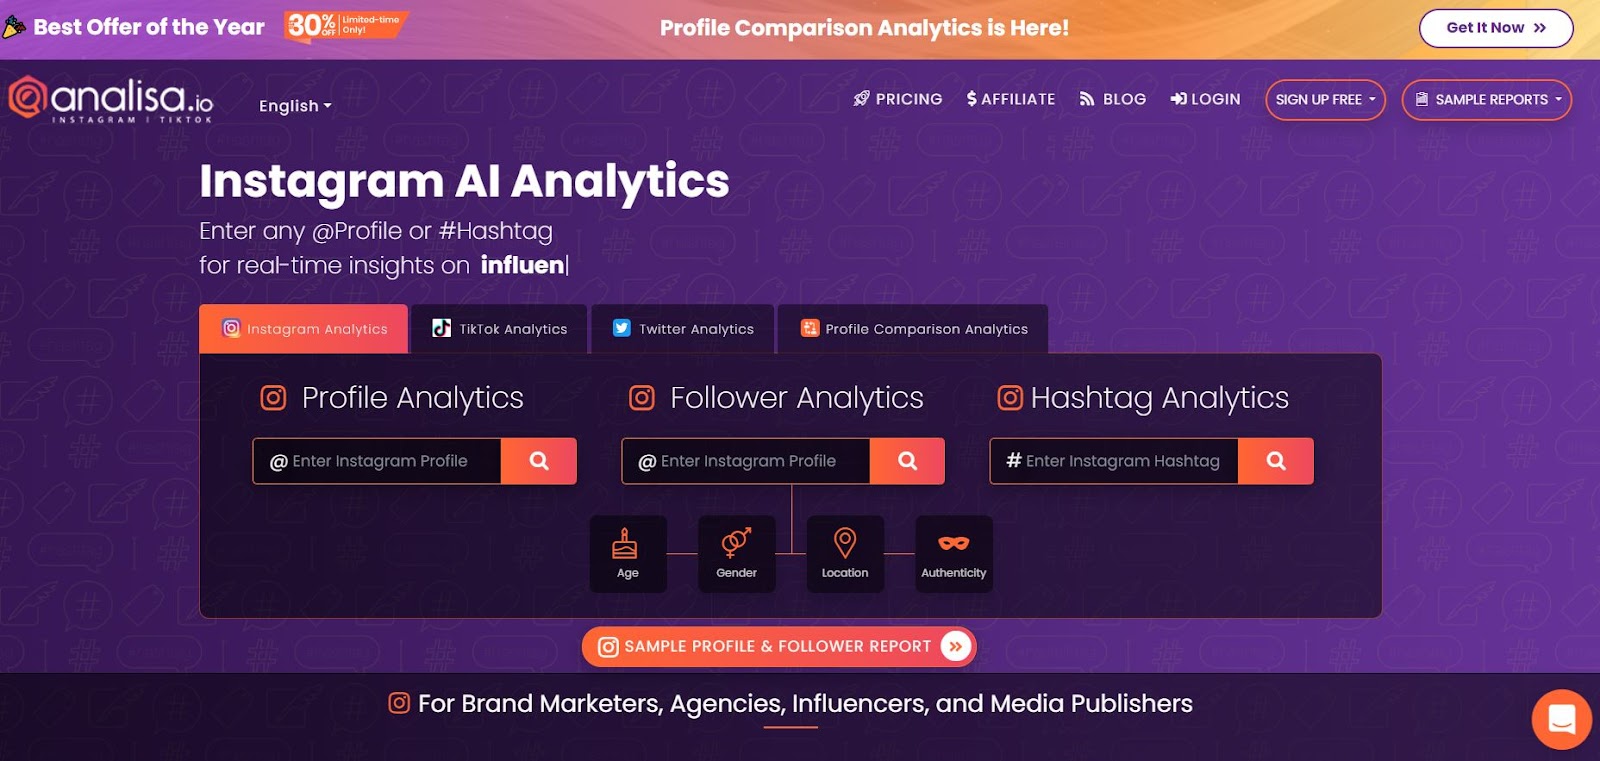
It provides insights such as Engagement Rate, Like Rate, Comment Rate, Average Engagement Rate, Total Posts (with daily, weekly, and monthly breakdowns), Tags and Mentions, Posting Map, Posting Activity, Audience Engagement, Average Likes and Comments Per Post, and Caption Words and Hashtags Most Used.
Analisa Pros
- Optimal Posting Times: The platform provides valuable posting activity data, helping users identify the times when their posts receive the most engagement. This information is crucial for maximizing the impact of social media content.
- Hashtag Reports for Research and Reporting: Analisa.io’s hashtag reports serve a dual purpose, allowing users to conduct pre-campaign research to refine their strategies and post-campaign reporting to evaluate campaign performance effectively.
Analisa Cons
- Limited Audience Data: The platform’s audience data may lack important psychographic insights, limiting the depth of understanding about the audience.
- Lack of Team Collaboration Tools: Analisa.io offers multi-user plans but lacks team collaboration tools.
- Email or Social Media Login Requirement: To access the analytics, users are required to log in with their email or social media accounts.
Analisa Pricing
Pricing for Analisa.io Plans:
- Basic Plan: Free.
- Pro Plan – $239.00 USD Per Month.
- Plus Plan – $149.00 USD Per Month (Most Popular).
- Premium Plan – $69.00 USD Per Month.
It’s worth noting that the availability of certain features and usage limits may vary depending on the selected plan.
5. Squarelovin
It is a free Instagram tool that will help you understand your Instagram performance. According to their claims, you can see how your posts are doing each month and look back at your past content by the hour, day, month, or year to spot trends and improve your posting schedule.
Squarelovin promises to give insights into your Instagram audience, like what they like and what interests them. This helps you create content that connects better with your followers. Additionally, the tool claims to suggest the best hashtags and filters to use based on what gets the most engagement from your followers, which can boost your brand visibility on Instagram.
Squarelovin Pros
- Comprehensive Analytics: Squarelovin offers detailed insights into follower demographics, engagement rates, and how your content is performing.
- Content Planning and Scheduling: It provides tools for planning and scheduling your content in advance.
- Content Creation: Squarelovin includes a content creation tool, which can streamline the process of designing and crafting your Instagram posts.
- User-Friendly Interface: The platform boasts a user-friendly interface, making it accessible to users with varying levels of technical expertise.
Squarelovin Cons
- Performance Issues: Some users have reported slow loading times and glitches when using Squarelovin. These technical issues can disrupt workflow and negatively impact the user experience.
- Lacks Competitive Analysis and Social Listening: Squarelovin does not provide features for competitive analysis or social listening. These features are important for gaining insights into your competitors’ strategies and monitoring social media conversations related to your brand or industry.
Squarelovin Pricing
This Instagram Analytics is a completely free tool.
6. Sprout Social
This Instagram analytics tool claims to help businesses by not only analyzing Instagram but also managing Facebook, Twitter, Pinterest, and TikTok all in one place. According to their claims, Sprout Social provides a Competitor’s Report that shows how you’re doing compared to others and suggests ways to improve your content marketing strategy.
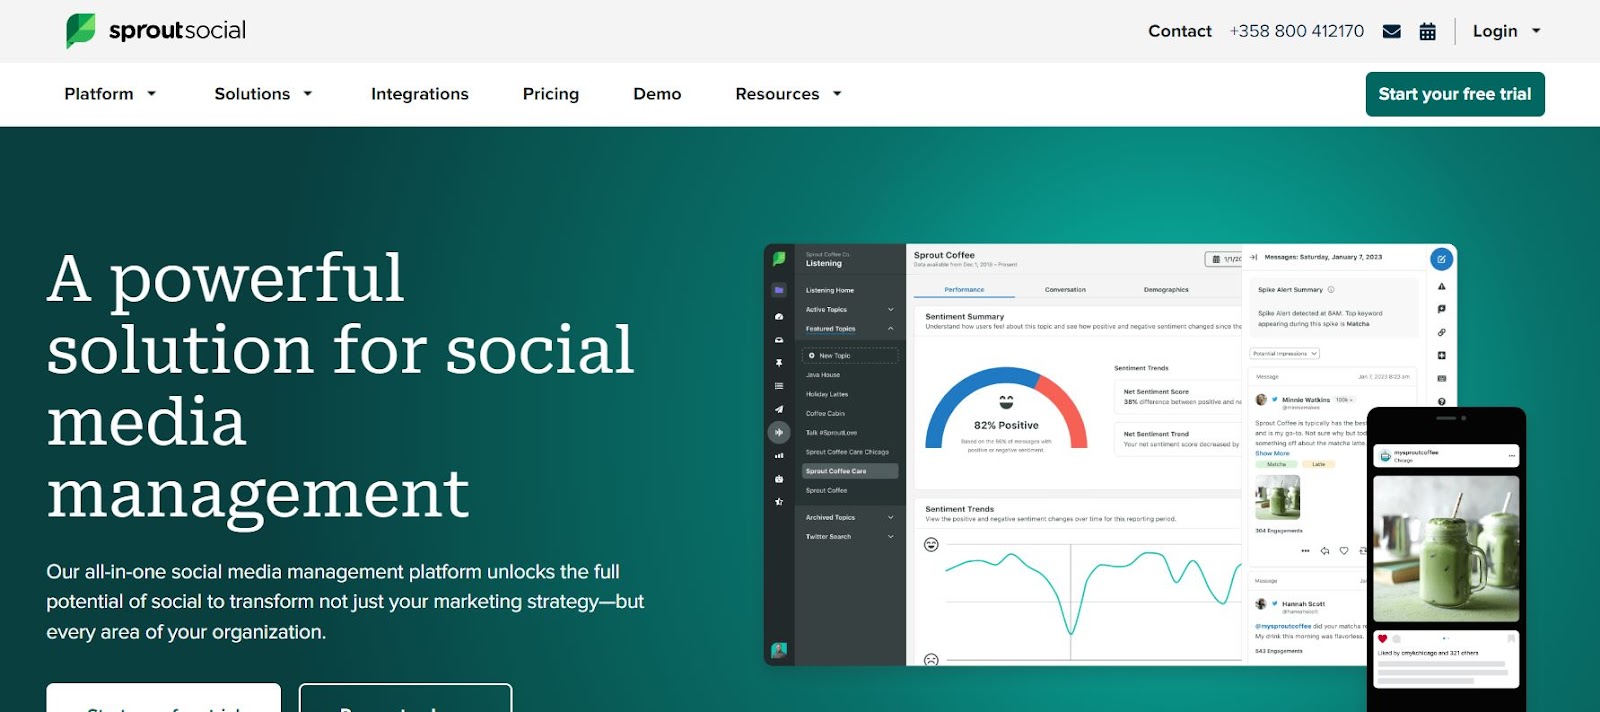
Their Competitor’s Report, for example, offers insights into your share of voice and hashtag performance, giving you specific, actionable recommendations to refine your content strategy and positioning.
Sprout Social Pros
- Scheduling and Publishing Tools: Sprout Social offers scheduling and publishing tools to manage multiple social media accounts efficiently. You can create, view, and edit a customizable publishing calendar to plan and schedule your content in advance.
- Social Media Listening: The platform’s social media listening tool provides insights from social conversations. It allows you to track hashtags, keywords, industries, brands, and multimedia content, helping you analyze sentiment and discover trends on major social platforms.
Sprout Social Cons
- Steep Learning Curve: Sprout Social has many features, making it challenging for new users to learn. Some users find features like reporting overwhelming and time-consuming to navigate.
- Slower Customer Support: Users have reported slower response times from Sprout Social’s customer support, with responses sometimes getting redirected to email and taking up to a day to receive a reply.
- Lack of Important Scheduling and Reporting Features: The platform lacks essential features like easy hashtag storage, smooth social tagging, and comparison reporting. These limitations can make content management and analysis more time-consuming.
Sprout Social Pricing
Sprout Social offers 4 plans, including:
- Standard:
- Price: $249 per month.
- Each additional user: +$199/mo.
- Professional:
- Price: $399 per month.
- Each additional user: +$299/mo.
- Advanced:
- Price: $499 per month.
- Each additional user: +$349/mo.
- Enterprise:
- Custom-built plan to meet your needs.
- Contact Sprout Social for pricing details.
Note: All plans come with a 30-day free trial, and no credit card is required to start the trial.
7. Keyhole
It dubs itself as an Instagram analytics platform that focuses on providing Instagram hashtag analytics and keyword tracking, in addition to offering the standard Instagram metrics. This tool is primarily designed to assist users in evaluating the performance of branded hashtags, monitoring promotions, tracking user-generated content, and keeping tabs on Instagram contests in real- time.
It can also be a valuable resource for those who collaborate with influencers and need to analyze Instagram analytics. But, it’s essential to explore Keyhole’s pros and cons to make an informed decision.
Keyhole Pros
- User-Friendly Interface: Keyhole offers a straightforward and user-friendly dashboard that makes it easy for users to navigate and access the platform’s features.
- Historical Data Access: Keyhole provides valuable historical data, allowing users to track trends such as Instagram Reels trends and performance over time.
- Report Downloads: Keyhole allows users to download reports and analytics in PDF format.
Keyhole Cons
- Tracker Setup Required: Users may encounter the initial challenge of setting up trackers on Keyhole.
- Feature Disparity Between Free and Paid Versions: Keyhole exhibits a significant disparity between its free and paid versions in terms of features.
- Limitation on Hashtag Usage: Even when paying for the monthly subscription, Keyhole imposes limitations on the number of hashtags users can track.
Keyhole Pricing
Keyhole offers a range of pricing plans to cater to different organizational needs:
SMB & Freelancers
- Price: $99 per month
Corporate
- Price: $299 per month
- Discounted Annual Rate: $239 per month (20% off)
Agency
- Price: $599 per month
- Discounted Annual Rate: $479 per month (20% off)
Editor’s Pick
In addition to utilizing Instagram analytics tools, it’s crucial to consider the power of an influencer marketing platform. Collaborating with well-known influencers can significantly enhance your Instagram account’s success.
These platforms connect you with reliable social media influencers who can promote your content, products, or services to their engaged followers, giving your account a substantial boost in visibility and engagement. This strategic partnership can help you tap into new audiences, increase your follower count, and ultimately achieve greater success on Instagram. Here’s the best platform in this regard!
Ainfluencer: Professional Influencer Marketing Platform
Ainfluencer makes influencer marketing simple and effective. Starting up on Ainfluencer is a piece of cake with their user-friendly website.
Once inside, you’ll see useful widgets for managing campaigns, invitations, deals, and more. Their AI-powered Campaign Creation crafts appealing titles that attract influencers.
Want to boost your sales? Sign up Ainfluencer for Free!
With features like Campaign Management, Invitations, Offers, and more, Ainfluencer is a toolbox for brand-influencer partnerships. Moreover, they have a massive database of 500,000 influencers and 24/7 support for help. In addition, its Influencer Search Tool lets you find the right influencer based on location, followers, and more.
Ainfluencer also ensures secure payments, holding funds until collaborations are fulfilled. It’s not just an app, it’s your guide to successful brand partnerships. Dive in and unlock your brand’s potential with Ainfluencer.
Why are you waiting then? Deal with Ainfluencer for Free right now!
To Wrap Things Up
To sum it up, Instagram analytics provide valuable information about how your account is doing. This data is crucial for making smart decisions to improve your Instagram strategy. With the help of top analytics tools, you can track your progress, understand your audience, and refine your content to achieve better results. So, don’t overlook the power of analytics – they’re your key to Instagram success!
FAQs
To view Instagram analytics, you must have a Business or Creator account. These account types offer access to valuable insights about your account’s performance.
Instagram analytics tools are specially designed applications that assist you in monitoring, comprehending, and utilizing the metrics and outcomes of your Instagram activities.
While truly comprehensive free Instagram analytics tools are limited, you can utilize Instagram Insights, the platform’s official built-in analytics feature. This provides some basic data about your account’s performance. However, many third-party tools offer either limited free features or a trial period, giving you a taste of their capabilities.
Instagram Insights is the native analytics tool provided by Instagram. It’s available to all business profiles and offers essential data on your account’s performance, including post reach, engagement, and audience demographics.
Generally, no. Most Instagram analytics tools with advanced features come with a cost. While some tools offer a limited set of free features or a trial period, you might need to consider investing in a paid plan for more comprehensive insights.