
Success on TikTok – how do you measure it? It doesn’t matter if you are a TikTok influencer or a brand looking for the answer. In addition to the number of followers, other indicators, including the number of likes, comments, and shares, can help you measure your progress on TikTok. But TikTok analytics are more in-depth, letting you track weekly and monthly growth, total video play time, viewer demographics, and more.
TikTok’s 1 billion monthly users have access to a massive audience, but just a fraction use it. For this reason, you must regularly review (and comprehend) your TikTok metrics. When you keep tabs on the correct indicators, you can zero in on the strategies that yield the best results (and tell hype from reality).
If your brand is new to the platform, TikTok analytics tools can take some of the calculations out of your TikTok marketing strategy. TikTok Business accounts get access to data that can guide both the frequency and content of uploads.
What Are TikTok Analytics?
TikTok analytics is a set of measures developed to assist creators and corporations in measuring the impact of shared videos. Using it, users can learn more about how their material is received. Followers, profile views, active users, a profile snapshot, and a video’s analytical performance can all be gleaned from these metrics.
All organizations and brands with a TikTok account should use the site’s analytics to keep their credibility and views intact in the face of fiercely increasing competition on the platform.
To know how many people saw your material on TikTok, you need to keep tabs on your account’s stats. It will assist you in creating premium content that includes increased methods of audience participation.
It takes zero rocket science to gain access to these TikTok statistics. In a nutshell, go from a standard to a business plan. You can follow the instructions below if you want to use TikTok for business or as an influencer.
How to Check Your TikTok Analytics and Stats?
You’ll need to upgrade to a Business account to view your TikTok analytics and statistics. The TikTok analytics tool feature is unavailable to regular users. You should immediately switch if you’re actively promoting a brand while using a standard account.
How To Switch To A TikTok Business Account?
Following these simple instructions, you may quickly upgrade to a TikTok Business account:
- Select the profile picture at the very bottom of the screen.
- Select the inclination icon (three vertical dots) in the upper right corner to access preferences and personal information.
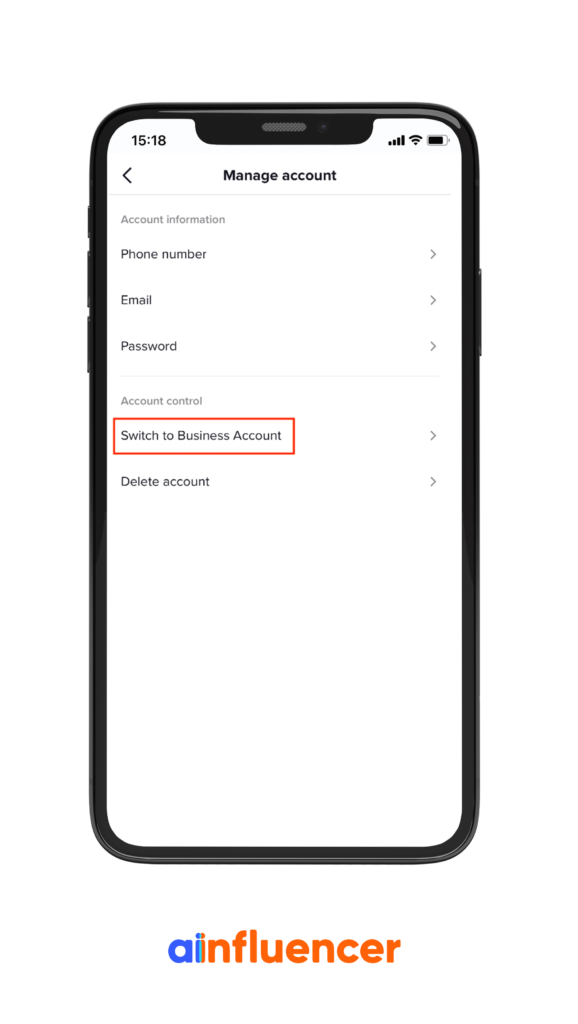
- Select Manage account.
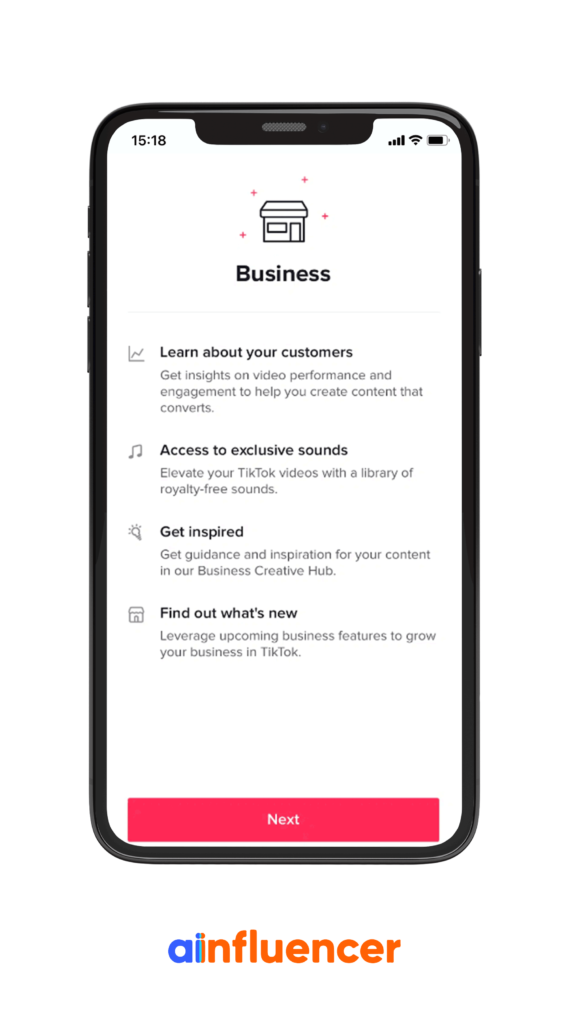
- Click to switch to a Business account.
- Click Next after reading the prompt.
- Select the best option that reflects your account type.
How To Check Your TikTok Analytics On Your Phone?
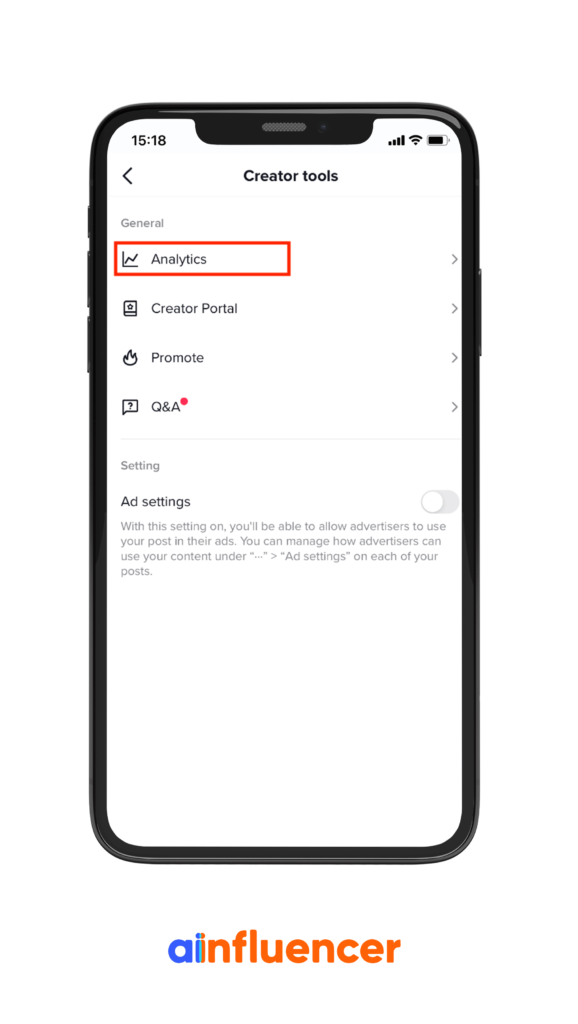
Select the little figure icon in the upper right corner to access your profile while using the app. This will take you to your profile, where you can access Creator Tools and Analytics by tapping the three dots in the top right corner.
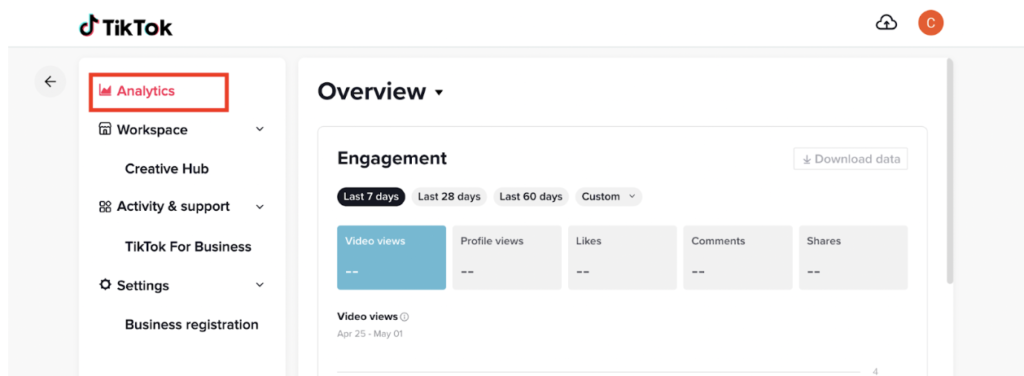
How To Check Your TikTok Analytics On Your Desktop?
If you’re already logged in to your TikTok account on your desktop, you can go directly to “tik.tok/metrics” to view your analytics without having to log in again.
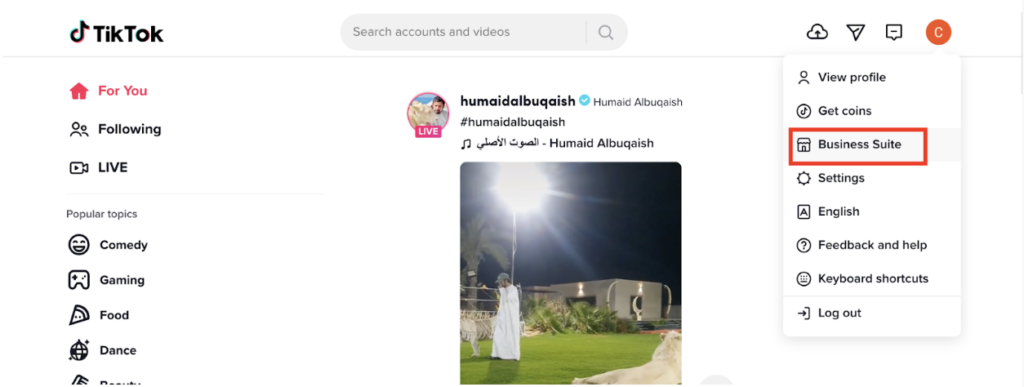
You may access the Business Suite on the main page of your TikTok business account by clicking the profile symbol.
This will take you to the part of your account called “Analytics.”
Key Areas of TikTok’s Statistics
Overview, Content, Followers, and LIVE are the four main analytical components of TikTok. Everyone needs TikTok user analytics, which are specializations within each umbrella category
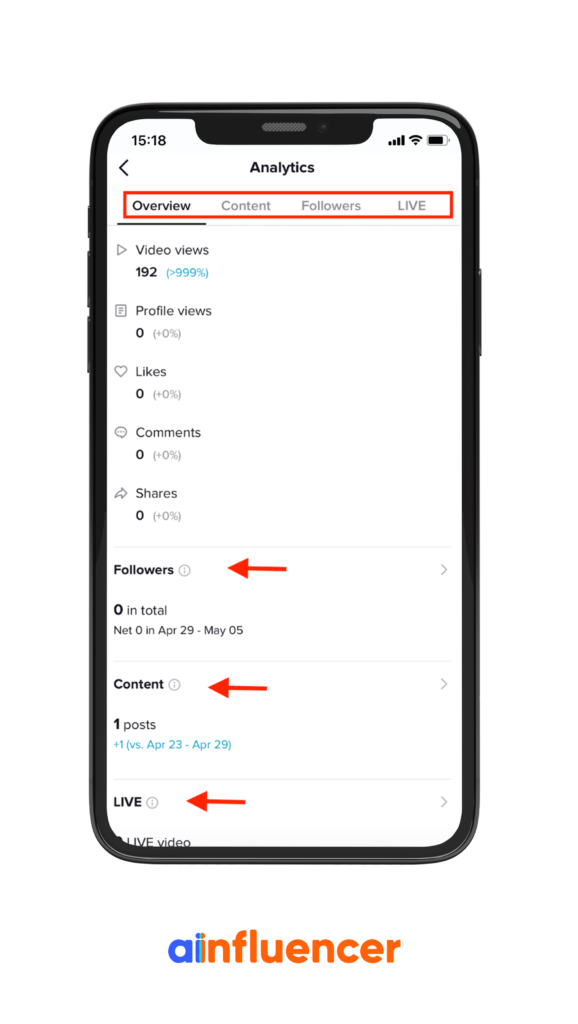
1- Profile Overview Analytics
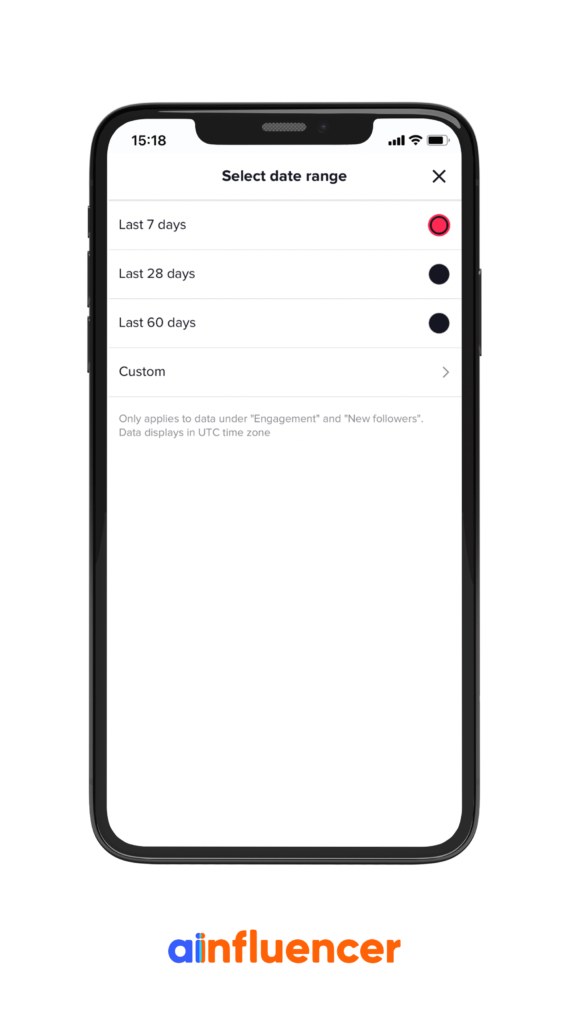
Within this section, you may see a bar graph detailing the total number of views your post has accumulated over the past week. To gain a more nuanced picture of your development and any TikTok trends or variations, you can view video performance over a specific date period or the last 28 or 60 days.
2- Content Insights
The next option in your statistics is the content tab, offering you more detailed information about the actual TikToks you’re posting, including your most viewed video on TikTok.
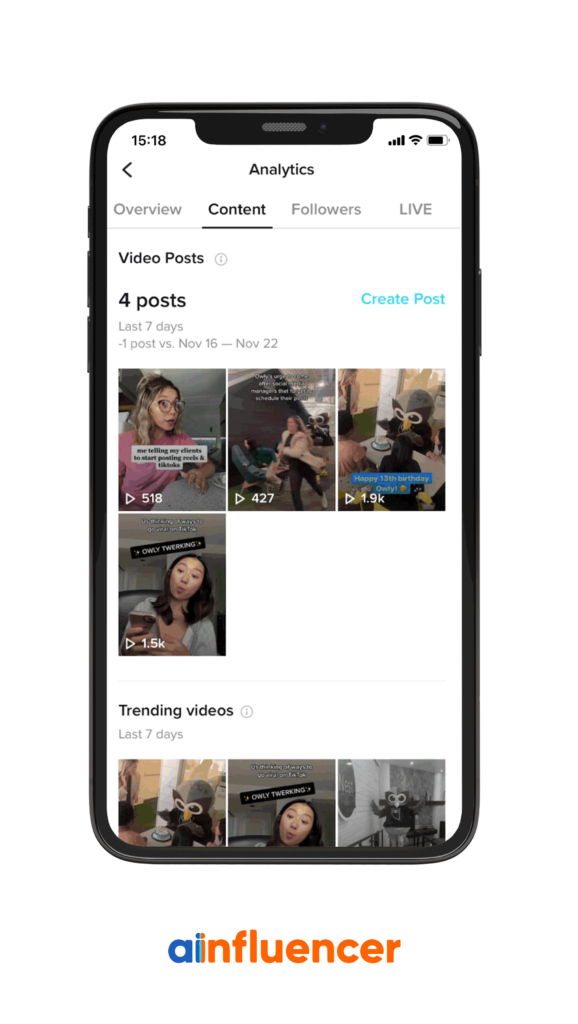
Video Posts
Here you can see an overview of how many people have seen the nine most recent videos you uploaded during the past week. The number of posts you made and whether or not that number was higher or lower than the preceding period will also be revealed.
Trending Videos
Within this section, you will find the nine videos that have experienced the most significant weekly percentage increase in views.
Video Views by Section
Here, you may observe whether or not people discovered your video through your profile or the “For You” feed.
Video Views by Region
This section tells you where your video was viewed and by whom, so you can pinpoint exactly where your audience is located and improve your video’s performance.
Average Watch Time
Indicative of how attractive your videos are to viewers, this is the average time spent watching them. How many viewers viewed the entire video is also trackable.
Total Playtime
Total viewing time is a valuable indicator of your video’s popularity and engagement.
Many of the data displayed in the overview are duplicated in the content tab, such as the number of likes, comments, and shares.
3- Followers Insights
The third section of your TikTok analytics displays information about your TikTok follower stats to discuss your viewership further.
To ensure your content is resonating with your target audience and encouraging follower growth on TikTok, it is always helpful to see exact followers and in-depth information about audience demographics.
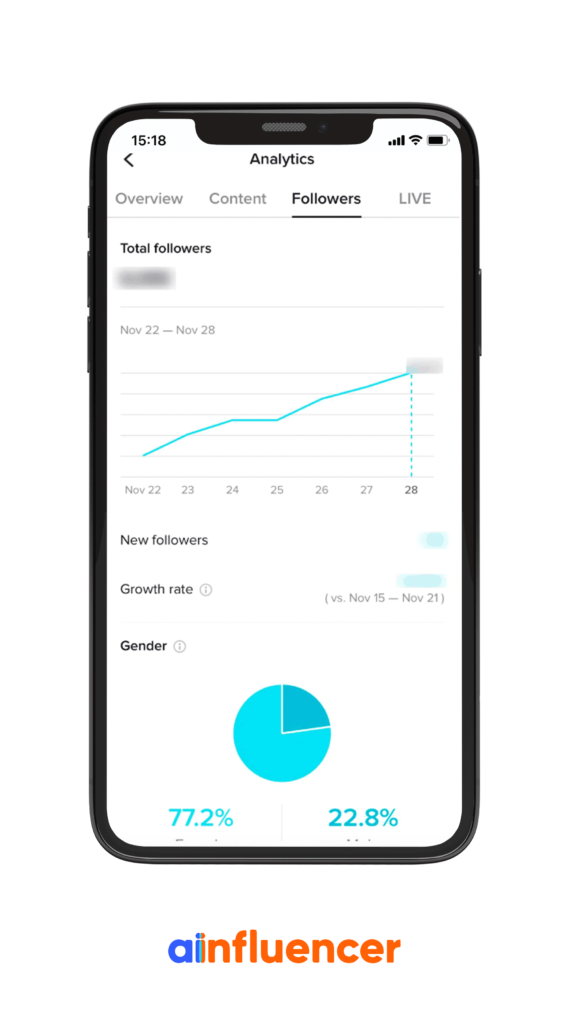
Followers
Total accounts that follow you and your net gain in followers are displayed here. A user’s net followers are their new followers minus their unfollowers from the previous week.
Growth Rate
Compare this period to the one before to see how many new or lost followers you had.
Gender
In a simple pie chart, you can see what proportion of your audience comprises each sex. Verify that this jibes with your assumed audience before proceeding with content production.
Top Territories
Followers are broken down by region here.
Follower Activity
Get a sense of when and how often your target demographic is most likely to visit your site with this helpful TikTok insight tool.
- Hours: To know when your followers are most active on TikTok, you can look at this analytics data. (It’s better to publish your content before the day’s busiest hours.)
- Days: Find out when your audience is most active by viewing data for each day of the week.
These data can be used to plan when you post on TikTok to maximize exposure to your audience. Focus on the times of day with the longest bars on the graph to determine when most of your TikTok viewers are active.
4- LIVE analytics
This section contains valuable information if you have recently hosted live videos, such as:
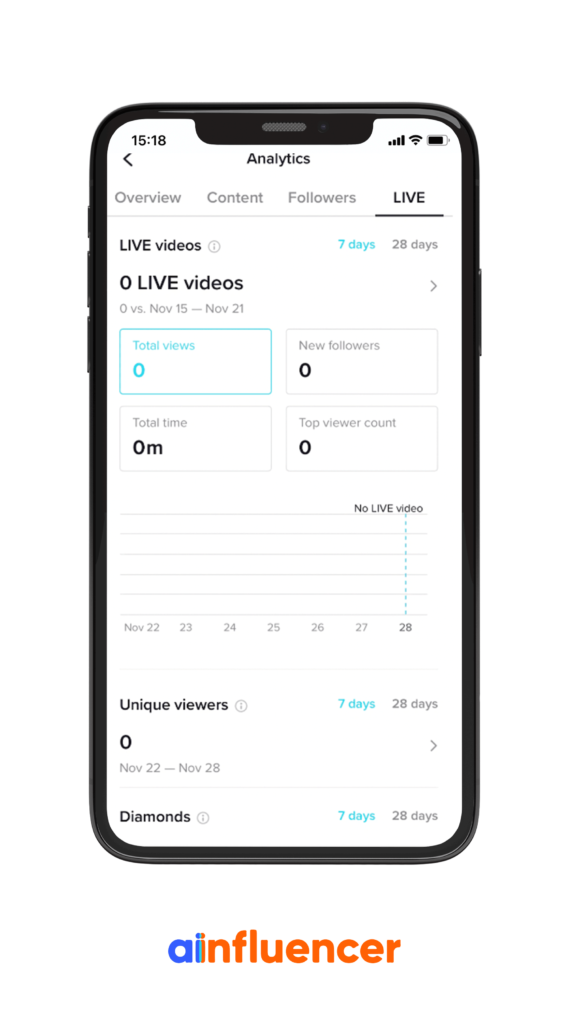
Total Views
The number of viewers for your live videos within your given date frame.
Total Time
The sum of the time you have hosted live videos throughout the specified time.
New Followers
During the time you specified, new followers are defined as TikTok users who started following you during a live video you were broadcasting.
Most people watching a live video at any given moment throughout the time you specified is known as the “Top Viewer Count.”
Unique Viewers
People who have never seen your live video before are considered unique viewers (even if a viewer replays your video, they are counted only once).
Diamonds
TikTok’s virtual currency is obtained through receiving virtual gifts from other users and is redeemable for real money.
What Do TikTok Analytics Metrics Mean?
Each of the four tab metrics has some subsections, which are all explained briefly:
Overview tab metrics
In the Overview section, you may find an overview of the following indicators:
- Video views: The sum of all times any of your videos have been watched in a given time frame.
- Profile views: A count of how often people viewed your profile during the specified time range. This metric on TikTok is an excellent indicator of user engagement with a given brand. It’s a gauge of how many people were intrigued enough by your video to check out your profile or your brand’s other content on the site.
- Likes: The sum of all likes your videos have gotten between the given dates.
- Comments: The total number of feedback on your videos between the specified dates.
- Shares: You can see how often your videos were shared in the time frame you picked.
- Followers: How many TikTokers are following your account, and how has that number changed over the selected time?
- Content: Sum of all videos you’ve uploaded and shared between the given dates.
- LIVE: the number of times you’ve broadcasted a live video during that time frame.
Content tab metrics
Video analytics are accessible from the Content tab.
- Trending videos: Displays the nine videos with the tremendous percentage increase in views over the past week.
- Total video views: The total number of times a video has been viewed on TikTok.
- Total like count of a post: Number of positive reactions to a post.
- The total number of comments: The total number of feedback on a particular post.
- Total shares: how many times this post has been shared.
- Total play time: How long viewers have spent with your video. While the playtime of a single post doesn’t tell you much, you can compare it to the play times of other posts to reveal your account’s average total playtime.
- Average watch time: How long, on average, people viewed your video. How well you kept people’s interest can be gauged in this manner.
- How many people watched the full video: Quantity of complete plays of the video.
- Reached audience: The sum of people who have viewed your video online.
- Video views by section: The origin of the clicks on your post. The “For You” feed, your profile, the Following feed, noises, searches, and hashtags are just some of the ways that others can find their way to your account. Here is where you can evaluate the efficacy of your use of hashtags and sounds to increase exposure.
- Video views by region: See where people are visiting from the most by looking at this section. This is how you can find out if your post or advertising campaign, which was tailored to a specific region, was successful.
Followers tab metrics
View information about your TikTok follower stats by clicking the Followers tab. This section is helpful as a source of content ideas because you can see your audience’s demographics and your followers’ specific interests.
- Gender: View the breakdown of your fan base by sex in this section. Keep doing what you’re doing if you’ve found a good audience.
- Top territories: The breakdown of your fan base per country. Be sure to target these areas when adapting content and advertising for a specific region. At most, five different countries can be displayed here.
- Follower activity: This graph will show you when your followers are most active on TikTok. Determine the peak posting times and stick to them religiously.
- Videos your followers watched: Here, you can see what your followers enjoy reading the most, giving you the ability to have a TikTok insight into what to post next. Try to check this area of the site frequently to see if you can glean any inspiration for future posts. You can also find suitable partners there.
- Sounds your followers listened to: You can tell what your followers are into by listening to the most popular tracks they have shared or liked on TikTok. If you use these findings as inspiration, keep in mind that trends on TikTok change quickly.
Consider making content that a wider audience can enjoy if you want to see more engagement in the Followers tab. You might also try influencer marketing, where you team up with an essential artist to promote your product to other communities.
LIVE tab metrics
The LIVE tab shows the following stats for your live videos in the last 7 or 28 days.
- Total views: The sum of all viewers for your live videos over the specified period.
- Total time: The sum of time spent in the time range you’ve specified hosting live videos.
- New followers: The total number of new subscribers you attracted during the selected time while broadcasting a live video.
- Top viewer count: The peak number of concurrent viewers for your live broadcast during the specified time.
- Unique viewers: The total number of unique viewers who tuned in to your live broadcast (in this stat, a viewer is only counted once, no matter how many times they replay the video).
- Diamonds: When you host a live video (and you’re 18+), viewers can send you virtual gifts, including “Diamonds.” You can swap these gems for actual money through TikTok—more info on that here. This data indicates how many diamonds you have earned in the given date span.
Conclusion
Boost your TikTok profile by learning more about your audience’s demographics and interests. You can get an edge over the competition by creating space for more exciting content and using what you know from your page analytics regularly. We hope this article has given you a foundational understanding of accessing and using your analytics.
To access your profile while using the app, select the little figure icon in the upper right corner. This will take you to your profile, where you can access Creator Tools and Analytics by tapping the three dots in the top right corner.
If you’re already logged in to your TikTok account on your desktop, you can go directly to “tik.tok/metrics” to view your analytics without having to log in again. You may access the Business Suite on the main page of your TikTok business account by clicking the profile symbol.
You’ll need to upgrade to a Business account to view your TikTok analytics and statistics. TikTok’s analytics feature is unavailable to regular users. If you’re actively promoting a brand but are still using a regular account, you should make the switch immediately.
You can see the gender breakdown of your followers in the “Followers” section of your Analytics. To see the gender breakdown of your followers, go to Analytics > Followers > Gender. A gender breakdown of your followers will be displayed as a pie chart. A percentage breakdown of each category is also provided.


![Read more about the article Ultimate TikTok Dropshipping Strategies & How to Collaborate w/ Influencers [2024]](https://blog.ainfluencer.com/wp-content/uploads/2024/05/Ultimate-TikTok-Dropshipping-Strategies-How-to-Collaborate-w-Influencers-2024-300x182.jpg)