Who does not want to improve their performance on a social media platform which is believed to be one of the most powerful tools for an online business? And what way of doing so is more promising than analyzing data effectively?
Say, how can being aware of the fact that over 25 million brands have an Instagram profile help you? Or in what way does your strategy correspond to the realization that over 80% of Instagram users are following at least one of these brands and over 70% of these followers are under the age of 35?
And above all else, how professionals have become full-time creators or run their successfully business on Instagram?

How to reach new people with data analysis?
If you wish to grow your Instagram presence, it would not be possible without data analysis. Keep in mind that you can only gain full access to data analysis when you switch to a creator or business profile. Having done so, look under your posts or go to your settings to tap on “insights”.
The first step is to use this analysis in order to reach a broader audience. By learning what is exactly happening on your feed, you will have a better understanding of your target audience and improve your content consistently as a result. Let’s set some goals so that we know how to use our analysis better.
- Measure your content habits
The first goal is to improve the posts you share. You probably have a wide range of different posts such as photo posts, video posts, IGTV previews, and carousel posts which consist of multiple photos or videos that are viewed by swiping or clicking. These are the most important questions you need to ask yourself.
- How many posts do you share per day?
- How high is the engagement rate per post you share?
- What are your best performing posts?
- What kinds of posts are they?
- Which strategies are working better regarding hashtags, tagging, and mentioning?
- Which strategies are working better with regards to writing captions?
2. Reap the benefits of the metrics
Use your data analysis in order to first answer the questions above and then improve the results you are not perfectly happy with. Here are the primary metrics you should use in a data analysis.
Reach on Instagram, the number of people who saw your ads. See who are the people viewing your posts, and learn everything about them such as their demographics to be able to reach more people by placing the focus on them.
Impressions on Instagram, the number of times that people saw your posts. This number is naturally larger than reach as many people are likely to view your content more than once.
If you sense people do not have enough interactions with the contents you share, you need to reduce the distance between reach and impressions, obviously, by increasing reach.
On the other hand, if you are mainly concerned with effective frequency, the extent which your ads get exposure, then impressions need to go up.
Hashtags analysis – check-in your Instagram insights to measure how effective your hashtag strategy is. You can generate more than 75% of your views by using hashtags if your strategy works well.
The number of likes per post – although likes are becoming a less significant metric in data analysis, you still need to keep an eye on how many likes you get per post. It might be the easiest and the first thing you naturally track.
The number of comments per post – this metric is more valuable than likes as it shows more real interaction with the contents you share. It is in fact very important to be able to create conversations when sharing a post. Do not hesitate to reply to your followers’ questions whether asked in the comments or as a direct message.
How to optimize your contents discoverability with a data analysis?
If you have reached this point in the article, this means you are intrigued by the idea of improving your performance on Instagram. The next thing you need to do is to ease the way for your audience to discover the contents you share on your profile.
Here are some good ideas that could be inspiring.
- Create good hashtag strategy with a data analysis
Hashtags, are considered as one of the most effective ways to increase your organic reach if you track them carefully. In order to be relevant as well as using popular hashtags, you can simply follow these metrics.
Metric #1 – average engagement per post for hashtag used
Metric #2 – best performing post with your hashtags
Metric #3 – top hashtags mentioned with your hashtags
You can gain access to your hashtag analysis through your Instagram insights or social insider.
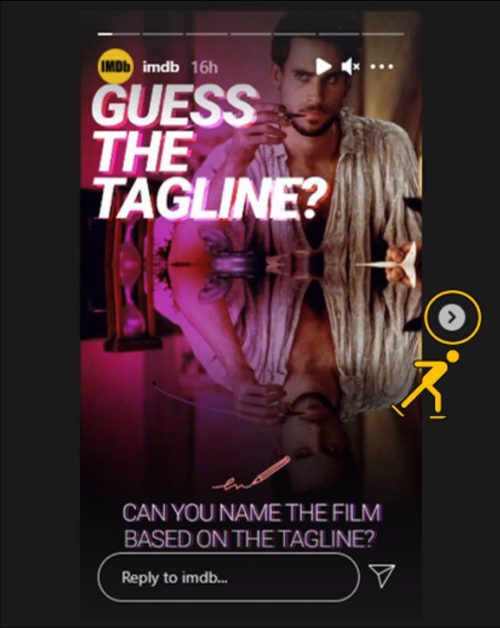
2. Increase your stories views with a data analysis
Business are taking to stories more than ever. Follow these metrics so that more people will view your stories.
Metric #1 – reach
Metric #2 – impressions
Metric #3 – frames per day
Track the number of frames per day in your stories to increase your reach and prevent over-publishing at the same time.
Metric #4 – the retention rate
In other words, it is the percentage of impressions of your last story divided by the impressions of your first story. With the retention rate at its peak, you realize that your audience is interested in and pays attention to the contents you share. This is one of the most important eCommerce metrics that place the focus on the strength of your brand’s contents.
Metric #5 – tap-forward rate
If your audience tends to tap forward your Instagram stories, it either means they do so in their eagerness to see the next frame or are simply ignoring your contents probably on account of over-publishing. The statistics show that if you have more than 12 frames, almost 80% of your viewers will just tap forward to see the next frame which is unlikely to be a good sign.
Metric #6 – tap-back rate
Unlike tap-forward rate, this one is always a good sign since it means re-engagement. Your audience has definitely felt the need to take a closer look and their attention has turned to your story which normally results in sale or interaction.
Metric #7 – reply rate
As the title is self-explanatory, it is about the percentage of the viewers who replied to your stories per day. This is also an important metric to measure engagement rate.
Metric #8 – exit rate
If your viewers tend to exit your story before your story ends this shows they are less engaged with what you share. The more you reduce this rate the merrier.
How to improve timing with data analysis?
Have you ever wondered when to share a post, story, or any other types of content? Then you are not alone as there is not one specific right answer for all creators, however, data analysis can show when the right time is for you.
Remember that good post timing requires your attention to the following elements.
- Your location
- Your time zone
- Your marketing goals
Statistics show that people are apt to check their Instagram feeds during lunch breaks, and immediately after their working hours’ end. Nevertheless, with the lockdowns and remote work during the pandemic this year, this equation has probably changed. Now we highly depend on our data analysis more than ever.
The audience section in your Instagram insights will provide you with a list of top locations – countries and cities – alongside your followers’ preferable time – hours and days – to be more active.

Conclusion
Learning to work with all these metrics in data analysis, you will follow the path of success, however, all these changes might seem sort of far-fetched to you. Do not try tracking them all at once. analyze some of them, consider the results, and move one step further. Eventually, you will be using your Instagram profile like a pro, and you will be the one who shows others what path meets with success.
Are you ready for your first data analysis to improve your performance on Instagram?